Cycle campaigners assert that safer streets will lead to more cycling, more cycling to safer streets. The question is whether this approach adopted initially by Mayor Johnson, and followed by Mayor Khan is delivering either of the desired outcomes. Is there more and safer cycling? Have the millions spent on cycling infrastructure been a good investment? Most importantly what should actually be done to improve road safety for Londoners on their streets.
Below I demonstrate, using Transport for London and DFT’s best kilometres cycled and collision data, that since 2017 (much of the segregated cycle tracks were put in from 2016), cycling has become not more, but less safe. There are more killed and serious cyclist injuries (KSIs). What is more, using the best data available, the rate of KSIs per km cycled has also increased.
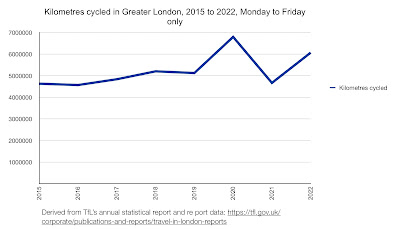
The previous Mayor of London introduced a gold standard cycle count to monitor his cycling vision. He established an annual count at over a thousand sites across the whole of Greater London, representing every road type and off road route type. The count, taken manually during the spring months, gives a reliable estimate of total kilometres cycled. The count started in 2015 and continued (though with some discontinuity) through the pandemic. The data is published in the Travel in London 15 data workbook. The latest data represents kilometres cycled in 2022. There is a note regarding some uncertainty during 2021. The count has a limitation in that it is a Monday to Friday count only.
A chart derived from these counts is shown below, and represents a good estimate of weekday kilometres cycled.
So much for kilometres cycled. Turning now to casualties. Road casualties are recorded by the Metropolitan and City of London police and reported by the Department for Transport. The data is a national statistic endorsed by the Office of National Statistics. The most common data set used as a benchmark is Killed and Seriously Injured (KSI).
It should be noted that:
- This data is subject to under reporting at lower levels of injury severity.
- Since 2016 police forces have changed their methodology in assigning injury severity which increased the number assigned as serious
I have used post 2016 data. TfL publish this data including provisional data for 2022 here. And as the data on kilometres cycled is only collected Monday to Friday, the chart below includes only weekday KSIs.
The number of Weekday KSIs has risen substantially since 2017 from 555 to 784 in 2022. This is a 42% rise. (Note: the 7 day rise is 50% up on 2017).
By any measure this increase in KSIs is significant. However there are those in the cycle campaign lobby who suggest that the only figure that matters is the rate of casualties per kilometre cycled. I’d argue that both the absolute numbers and the rate per kilometre are important.
So let’s consider the rate per kilometre. There are six years worth of excellent data that show kilometres cycled and number of KSIs . The relative changes in this data can be represented on a single chart by indexing both sets of data to 1 for 2017. It is clear from the chart below that KSIs are increasing at a greater rate than kilometres cycled. In other words there are both more cycling KSIs and more cycling KSIs per kilometre cycled
Millions of pounds of public money has been spent. Cycling as a mode has received all the policy attention. All other transport modes have been neglected including London’s bus services and the walking environment. (Many disabled people can no longer use their bus service). In spite of all the attention, cycle safety per kilometre cycled is not improving, and it appears to be getting less safe to cycle altogether.
What should be done? Prior to the 2013 Vision for Cycling TfL had a data-led approach to road safety, and casualties were demonstrably reducing. At that point TfL were on the cusp of a safe-systems approach. Since then Mayor Johnson did little to improve road safety. He did support work on commercial vehicle design and compliance. Subsequently Mayor Khan’s slower speed initiatives will have reduced casualties as also will the continuing work on direct vision for commercial vehicles. However, the blind faith in, and single focus on, shoehorning in segregated cycle tracks is neither delivering safer cycling, nor is it delivering much greater numbers cycling.
The campaign and slogan led approach of cycle campaigners should be set aside and a data-led approach to road safety should be adopted once more. The focus of road safety should be based on analysis of the causes of casualties.
As for getting substantially more people cycling - read my blog.


No comments:
Post a Comment