I havn’t blogged for a long time, but the publication by TfL of travel statistics earlier this year and similar data from the Dutch household travel survey allows a good comparison between Hackney and Dutch cities that is worthy of comment.
In May 2020 TfL published a guide for boroughs that included results from its London household travel survey. The sample size is small at borough level and so the data for three years is combined. The survey gets a 50% response rate. It’s a long running survey and a reasonable statistic. The table of mode share by borough, can be found at: (https://tfl.gov.uk/info-for/boroughs-and-communities/streetspace-funding).
In late 2019 the Dutch ministry of infrastructure published its ‘Mobiliteitsbeeld 2019‘ at: https://www.kimnet.nl/binaries/kimnet/documenten/rapporten/2019/11/12/mobiliteitsbeeld-2019-vooral-het-gebruik-van-de-trein-neemt-toe/Mobiliteitsbeeld+2019.pdf . This is a national compendium of transport statistics and includes modal share charts and commentary from their national household survey for five Dutch cities: Amsterdam, Rotterdam, Den Haag, Utrecht and Eindhoven. This too is a long running survey.
So what does the Dutch survey tell us?
Below is ‘Figure P1.1.3: Mode of transport distribution for journeys from, to and within the five major cities. Source: CBS, OViN 2015-2017’.
Clearly the Dutch cycle a lot, but they also drive a lot. Even in Amsterdam and Utrecht, both regarded as high cycling level cities, there are a lot of car trips. In the table below, both of the green segments are car trips: as driver and passenger. Utrecht has the lowest car share of trips at 27%, Eindhoven the highest at 52%.
As an aside, the Netherlands has a very high density of motorway compared to its European counterparts.
A Google translation of the accompanying text above states:
The five major cities in the Netherlands differ in the use of transport modes, when we consider the total number of journeys from, to and within the city. The use of the car is dominant in Eindhoven and Rotterdam, with 52% and 45% respectively of all trips made. Car use in Amsterdam (31%) and Utrecht (27%) is considerably lower. In these cities, the so-called 'active modes' (walking and cycling) have a high share in the trips made: 46% for Amsterdam and 44% for Utrecht. The Hague occupies a middle position, with a share of 42% for the car and 40% for walking and cycling. In the three largest cities, the share of bus, tram and metro is around 10%.
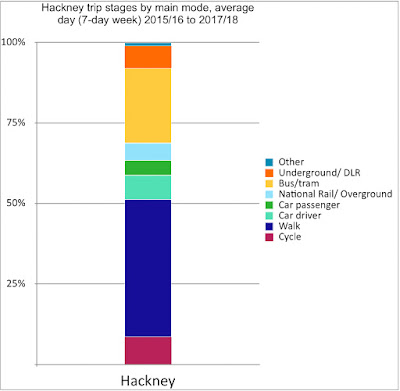
So how does Hackney do? The table below is derived from the TfL data. The order of modes is the same as the Dutch publication and the colours matched. Walk is highest, followed by the public transport modes. Cycle is at 8.5%, far higher than any other London borough. Private car is very low at 13%.


No comments:
Post a Comment