The cycle bloggers (and some academics and journalists) would have us believe that the matter of those who do and do not cycle is one-dimensional. They say that the main thing that prevents people from cycling is fear of road traffic linked to feelings of personal safety. However the picture below suggests that the picture is more complicated.
Below are some of the statistics relating to cycling. The information comes from three sources. Firstly Census 2011. The Census is a good data source because it cannot be manipulated, participation is mandatory and, unlike many cycling surveys that are promulgated, it shows how people actually travel, not how they 'say' they might travel. The other authoritative surveys are Transport for London's Travel Demand Survey and Transport for London's analysis of cycling potential (the number of journeys that might be cycled).
Note also that there is academic research which suggests that Census figures are a good proxy for cycling statistics generally.
If you cycle in London you will probably live in inner London
Census 2011 found that 7.2% of commuters in inner London cycled to work compared to 2.3% overall. Hackney has the highest level of cycling commuters of any London borough, double the inner London average, at 15.4% and much higher than the next highest borough, Islington, at 10.1%.
Transport for London's survey, the London Travel Demand Survey reports 7% of all journeys (not just commuting journeys) are undertaken by cycle in Hackney. TfL's analysis of cycling potential indicates that Hackney has been particularly effective in realising its' cycling potential with 24% of cycleable journeys actually being cycled, almost 10% higher than the next borough (Hammersmith and Fulham).
However, if you live in Harrow you almost certainly won't cycle to work. Only 869 (or 0.8%) of residents do so.

If you cycle in Hackney you'll probably be white British
Note also from the graph below that the Census category of Black/African/Caribbean/Black British people are major users of the bus.

If you cycle in Hackney you'll probably have a white collar job
The Census reports socio-economic classifications against method of travel to work. Higher professional occupations are hugely over-represented in the cycling figures.
22.5% of those in higher professional occupations cycle to work. In comparison 7.1% (a third) of those in semi-routine occupations do. 63% of those residents of Hackney who cycle to work are in managerial, administrative or professional occupations.

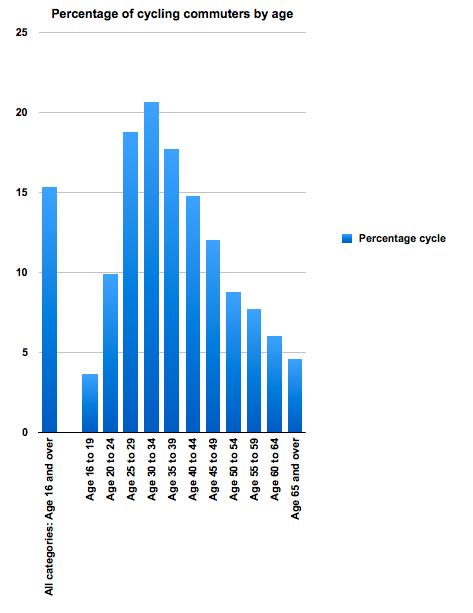
If you cycle in Hackney you'll probably be aged 30 to 34
20.6% of those aged between 30 and 34 cycle to work. Only 9.9% of those between 20 and 24 years do. 55% of those residents of Hackney that cycle to work are aged between 25 and 34 years old.
If you cycle in Hackney you'll probably be male, but are more likely to be female than in any other London borough
In countries where cycling is much more prevalent there is close to parity in cycling rates between the genders. Although it is some way off parity, Hackney is significantly better than the inner London average.
Cambridge in particular does well both in terms of levels of cycling and gender balance.

If you cycle in London you will probably live in inner London. If you are a Hackney resident you will probably be white; have a managerial, administrative or professional occupation; and be a 25 to 34 year old male.

The absolute figures for ethnicity are telling: of the 16,411 who cycle to work in Hackney the Office of National Statistics classify 13,875 (85%) as 'White'. This is in the context of a resident population of 246,270 in one of the most diverse boroughs in the UK with a walking share of all trips at 37%; bus trips at 26% (the highest in the UK) and cycle trips of 7%.
The cycle bloggers would
have us believe that everyone wants to cycle and the single thing that would make people cycle would be to introduce separated cycle tracks, bus stop bypasses and associated junction treatments to our streets. They say this course of action should be pursued, whatever the cost and regardless of detriment to others (in particular people walking and those using the bus). The argument is that it is largely fear of motor vehicles that puts non-cyclists off from cycling.
This cannot be true. Is the proposition that fear is behind the five fold difference in cycling rates of 21% to 4.3% of two different ethnic groups really plausible? Similarly can anyone truly believe that it is fear of motor traffic alone that means that one socio-economic group cycles at a rate of 22.5% and another at 7.1%? The differing rates between different age groups are clearly also worthy of more analysis and consideration.
Although road safety fears will be a reason why people choose not to cycle it simply cannot be the only reason. More sophistication is needed if the right mix of policies are to be pursued so as to genuinely encourage a broader range of people to cycle. The vogue for segregated tracks on relatively narrow roads seems to additionally privilege an already privileged group - by giving this group dedicated street space. This space is given to the detriment of walkers and bus users, and walking and buses are the most space efficient modes of transport. After all, not all may wish to cycle and many may simply want to get on the bus and read a book!
Although road safety fears will be a reason why people choose not to cycle it simply cannot be the only reason. More sophistication is needed if the right mix of policies are to be pursued so as to genuinely encourage a broader range of people to cycle. The vogue for segregated tracks on relatively narrow roads seems to additionally privilege an already privileged group - by giving this group dedicated street space. This space is given to the detriment of walkers and bus users, and walking and buses are the most space efficient modes of transport. After all, not all may wish to cycle and many may simply want to get on the bus and read a book!
Some acrobatics at reasoning here. You've admitted what the demographic of Hackney cyclists is but then claim that it is thanks to Hackney's policies that such a rate exists (only 1% higher than the next highest boroughs) and not at least in part to its fortunate position relative to central London, the car free routes along the river Lea, and the gentrification that has been occurring. Meanwhile you think that the cycling infrastructure in the Netherlands which results in Turkish, Moroccan, Surinamese, and Antillean populations cycling 9%, 11%, 13,%, and 15% of their journeys respectively ( all higher levels than Hackney) has nothing to do with it.
ReplyDeleteAll this is supposedly an argument at stopping cycling infrastructure. Tell us, what is the solution you propose to reach the Dutch levels of cycling? Have you actually paid a visit to a Dutch city with good examples before writing these articles?
Michael, Thanks for this. Do you have any suggestions as to why the differences in cycling rates of different groups is so great?
DeleteI couldn't say, no, and I agree that there is probably more to it than the infrastructure alone. However, you seem to be using it as an argument against the infrastructure, when quite clearly it has resulted in a smaller disparity and a much more inclusive environment.
DeleteMichael, I think all of the stated preference surveys that are used to promote tracks aren't worth a row of beans and bear no relationship to what people actually do. And as such no basis for policy on cycling. Deciding what treatments are appropriate for different roads should be done on the context of the street and it's uses, not fantasy .
ReplyDeleteLooking at what works in cities all over the world to encourage people from all classes and ethnicities, might be a better guide to what should be done ?
DeleteAnd city after city have proved that building protected infrastructure leads to large increases in cycling, something that is essential for the health of large majority of your constituents.
Hi, I've been reading your stuff with interest. I'd take issue with further privileging a group - increased safety shouldn't be regarded as privilege. But you're also right, safety/fear isn't the only driver to getting people cycling; cultural drivers should be addressed too, but that kind of change is much harder and nebulous to affect.
ReplyDeleteI agree that safety is not a privilege. But where I disagree is I think society should direct limited resources where it can do most good. BAME children are hugely over represented in the casualty statistics. Tackling that issue should be a priority for example. 80% of collisions occur at junctions. Spending there should be a priority. Conversely there will be very few casualty savings at bus stops.
DeleteBreath taking unscientific abuse of statistics. London has built almost no protected cycle lanes over the last decade - we are finally getting a measly 37 km of good standard lanes due to Boris.
ReplyDeleteBut almost every other city that has built good quality well located cycle lanes has seen cycling soar, among all classes.
You completely fail to address the huge obesity, diabetes and cancer rates among those not cycling to work.
In your blind drive to introduce class war into the subject, you do the classic inverted snobbery of condemning people to early death rates.
Truly shocking that you as chair of a planning committee and policy officer for the publicly funded Travel Watch are so ignorant of the real facts about cycling.
Maybe go on a field trip to the Netherlands if you want to really benefit working class people and people of all ethnicities in your Borough.
Hi, Thanks for this. Do you have any thoughts as to the reasons why there is such a difference between ethnicities?
DeleteHi, Thanks for this. Do you have any thoughts as to the reasons why there is such a difference between ethnicities?
ReplyDeleteThanks for this. Can you suggest why there is such a difference in cycling rates between ethnicities?
ReplyDeleteWealth, cramped living conditiona would, I assume, influence cycling rates among different communities. This needs to be addressed.
ReplyDeleteBut if the pro - cycling groups manage 22% work trips with current conditions, what might be the missing link to match copenhagen 36% rate and aspiration to hit 50?