Saturday 2 December 2017

Coming to a bus stop near you.

The overwhelming proportion (80%+) of collisions that result in injury to cyclists occur at intersections. Targeting improvement at these locations along with slower speed initiatives and traffic reduction should be the key road safety interventions. 

However, the cycle bloggers who frame cycling as a dangerous activity, also tell us that cyclists must 'feel' safe. Cyclists, they say, cannot pass the bus, nor the bus pass the cycle.

The solution is the 'bus stop bypass' - cycles are routed through the pavement and around the back of the bus stop. Pedestrians and bus passengers have to watch out for cycles and dodge them when necessary. If they get hit, then that's OK because its not as bad as getting hit by a vehicle. 

This is clearly disrespectful of bus passengers and pedestrians who will now 'feel' unsafe and worry about cycles, when previously they were safe on the pavement. There are all manner of vulnerable people at bus stops, older, blind and partially sighted people, some with learning difficulties. The groups that represent these groups generally oppose these changes to bus stops, but aren't listened to.


Below are an assortment of what London government has come up with to accommodate the cycle bloggers. They are coming to a bus stop near you and will degrade the pedestrian environment. Bus passengers will just have to put up with. 

Stratford High Street - Whoa

The bus stop bypass needs a lot of pavement width and so the boroughs are mimicking the bus stop bypass with an even more problematic solution - the cycle lane that passes directly through where passengers wait, board and alight. Passengers effectively step into the path of the cycle!

Waltham Forest, an award winning borough, have lots to spend on bus stops to the detriment of bus passengers. The borough has numerous examples.


A busy stop that will get busier in the future

Waltham Forest bus stop cycle lane

Camden is said by the bloggers to be a good cycling borough. They have installed the bike lane below, squeezed between shelter, post box and pedestrians. 


This Royal College Street stop is very busy with passengers,
 even with only one bus service.

One of London's busiest bus stops is at Elephant and Castle. Here the bike lane is squeezed in behind two stops and the building line. On the opposite side of the road it was just too difficult so they moved half the passengers around the corner where they would be less problematic for the bikers.


Passengers have no political power
and have lost the pavement at Elephant
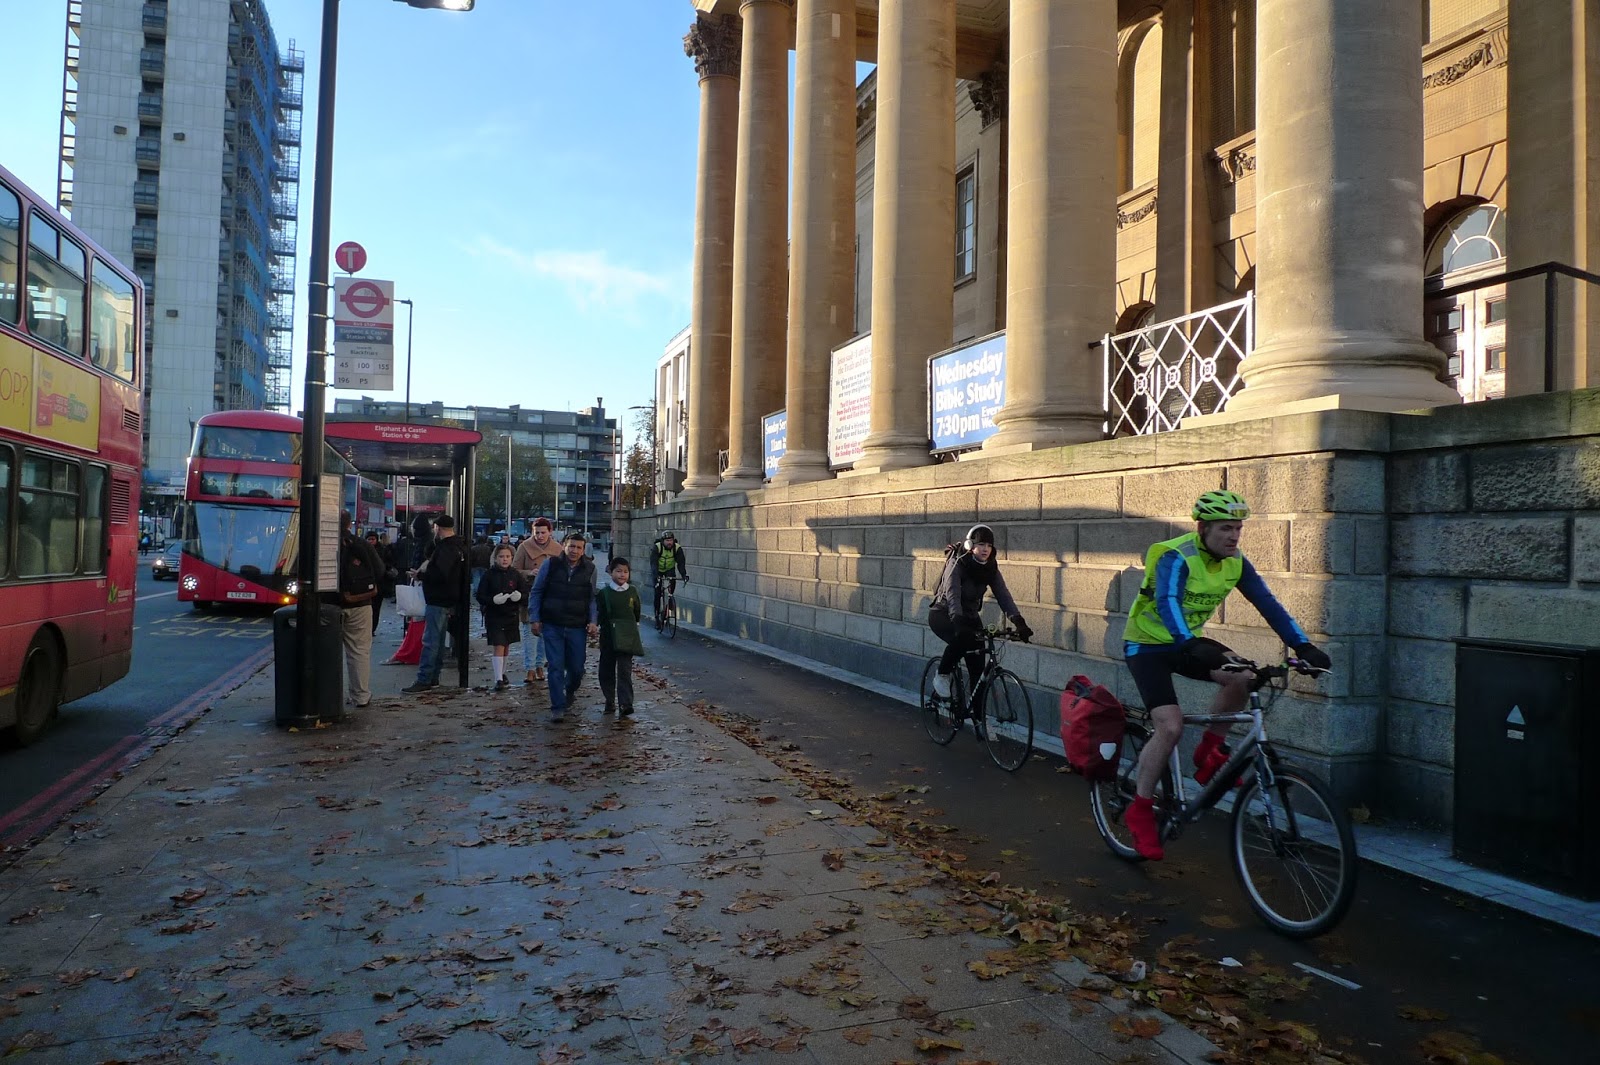
The cycle bloggers have the political power 
and the pavement


Back to Royal College Street, the Camden award winner. At night or when its raining, you're on your way home. Be sure to watch out for cycles through your stop.


Royal college Street stop at night

Enfield have introduced dozens of stops along the A105. There are different designs that keep elderly bus passengers on their toes. Cycles go through the boarding and alighting area on some, around the back of others. Fortunately there are neither many bus passengers, nor cycles in Enfield, but the main demographic of passengers will be older people and they now have to negotiate this.


The bikers campaigning has trumped the
 needs of older people.
Enfield 2


Whitechapel High Street, one of London's busiest high streets is now blighted by the paraphernalia  of bike lanes. There are over 30 stops between Stratford and Aldgate.
It should be a great city street, but now there is no chance of that. Six inch kerbs ensure its really uncomfortable and unpleasant being a pedestrian. But pedestrians are not what the pavements have been designed for.

The bloggers will tell you trashing our high streets is good for business !

The footway was too narrow even before the bike track arrived
Back to Camden. An optional bus stop bypass that most cyclists avoid because there is rarely a bus. If they do use it, then they should do so with great care, because it directs you into the path of unsighted, turning vehicles.

Street layouts should be simple and understandable, not multiple-choice!
And so it goes on. Every location is different and so the designers have come up with a different solution for each. No one has worried about the bus passengers, how much space there is for them or how many passengers there are.  Bus passengers fit around the biker.

The latest modification to try and deal with the problems that have been created for bus passengers is a zebra type crossing of the pavement, complete with Belisha beacon!
A zebra crossing with Belisha beacon on the pavement!
London has thousands of bus stops with any number of vulnerable passengers that have hitherto been able to use their bus stops in relative comfort. Some are blind or partially sighted, old, mobility impaired, some with learning difficulties or just travelling home in the rain at night. All will have to put up with what the cycle bloggers call space for cycling whether they like it or not. This is unfair and disrespectful.

The 'flag ship' cycle lanes Waltham Forest are installing contain a double whammy for bus passengers. Not only does it run cycles through the bus stops they have used the eastbound bus lane for the cycle lanes!

One of many bus stops cycle lanes along the Lea Bridge Road
Served by three important trunk bus routes, the bus lane has been used for a cycle lane 

London's high streets should be full of life. They should be great public spaces, for public life. They have to accommodate multiple uses and users, not just movement. London's streets should be beautiful, walking should be easy and the should be inclusive. 

The bloggers say these bus stops work. What they mean is that they work for the bikers. 


Bus stop bypasses are said to work, but for whom?

Thursday 3 August 2017

Fact checking Dr Rachel Aldred's latest blog

Dr Rachel Aldred has just published her latest blogIn which she states:
"Each year, Hackney consistently has more cyclist than pedestrian casualties."
But is this true?

Dr Aldred doesn't tell us how many, nor which years her comment refers to. The data  for years 2000 to 2015 is published. 2016 data is not.

These casualty figures are set against a backdrop of a significant growth in the population - 70,000 or 35%, additional residents since 2001 and a significant rise in the popularity of cycling.

The graph below shows cycle and pedestrian fatalities since 2000.


The second graph shows cycle and pedestrian serious injuries since 2000.


And finally the graph of cycle and pedestrian slight injuries, those not needing hospital treatment.


From these graphs it is clear that Dr Aldred's comment that Hackney consistently has more cycling than pedestrian casualties isn't true. 

It is even less the case if one does as cycle campaigners suggest and one were able to consider casualties per mile cycled, because there is much more cycling now than there was in 2000.

The data show that:
  • between 2000 and 2015 there were 17 cycle fatalities compared to 47 pedestrian fatalities; 
  • there were 379 serious cycle injuries compared to 706 pedestrian serious injuries between 2000 and 2015, and that the annual figure is fairly stable despite the large growth of cycling in Hackney;
  • that cycle collisions resulting in a minor injury are increasing as cycling becomes more popular in Hackney. There is also an upward trend in pedestrian collisions resulting in a minor injury.
Every injury is a personal tragedy. But If one were interested in the truth, rather than being determined to frame cycling as a dangerous activity, one would say that Hackney council has been successful in its borough-wide approach to cycle and pedestrian road safety since 2000. It is a testament to all those involved and should not be undermined. The rate of cycle fatalities and serious injuries is reducing. Slight injuries to cyclists are increasing, but below the rate of increase in cycling.

For the record he graph below shows Hackney killed and serious injuries for all modes on Hackney's streets and in total.


Friday 17 March 2017

Cycling is getting safer In London

I've fact checked the recent Hackney Cycling Campaign's cycle safety press release . In this Blog I describe what you can reasonably discern from the published statistics on cycling.

Firstly, you can only meaningfully consider casualty rates from a London wide perspective, because although we know how many casualties there are in each borough each year, there is no reliable cycling volume statistic available for individual boroughs. 

Transport for London (TfL) publish estimated cycling trips statistics for the whole of London in their annual statistical publications Though it must be noted that this is a statistic of trips, not miles travelled. These are available on their website. The Department for Transport (DfT) publish the Met police statistics of collisions and casualties. This data is also available on the TfL site.

The growth in cycling trips is shown in the graph below. Cycling more than doubled between 1995 and 2015. (The upturn is associated with the introduction of congestion charging in early 2003.) 


Volume of cycling in London (Estimated number of trips) since 1995

During the same time, 1995 to 2015, the number of cycling casualties (all severities, minor to fatal) dipped and then rose again. These figures are shown in the graph below.


Absolute casualty figures since 1995

These statistics can be represented on the same graph by equating both of the 1995 figures to 100 and showing the following years relative to 100. 

The resulting graph shows how cycling has risen as casualty numbers remain broadly constant.

Cycling trips have increased whilst casualty figures have remained constant since 1995

The same representation can be repeated with the data on serious and fatal injuries. These are smaller numbers and so there is more variation.


Cycling trips and serious and fatal injuries between 1995 and 2015

And also with fatalities only. Here there is even more variability when comparing one year to the next.


Cycling trips and casualties between 1995 and 2015, indexed to 100

A reasonable conclusion from these statistics is that cycling is getting safer in London.

Monday 6 March 2017

Fact checking the recent Hackney Cycling Campaign road safety press release

I was intrigued when the @Hackney_cycling twitter account announced: "Is there any safety in numbers?" I clicked on the link to their website that says:

"New analysis of police injury data known as Stats19 carried out for Hackney Cyclists by Dr. Rachel Aldred shows worrying trends in the borough." 
And from Dr. Aldred:

‘Clearly cycling in Hackney has grown during this period, perhaps roughly doubling, but it’s a concern that there doesn’t seem to be much of a ‘safety in numbers’ effect for cyclists – in other words it hasn’t got much safer per trip, as cycling has gone up.’
The full statement taken from the Hackney Cycling website is reproduced at the bottom of this page.

But the Hackney Cycling Campaign analysis is partial and misleading. So here is a fact check of Dr. Aldred's 'analysis'. 

The claim is that cycle casualties went up in Hackney between 2005 and 2015 along with the numbers of cyclists, but that safety had not improved 'per trip'. The analysis states that there were 134 cycling casualties in Hackney in 2005 and that this went up to 250 in 2015. Dr. Aldred's figure for 2015 is one out, it is actually 249, however, this equates to an 86% rise between 2005 and 2015.

These figures are reliable, but care should be exercised in their use. The number of casualties can vary quite markedly from one year to the next and picking out two years figures to compare can be misleading. Looking at the trends and averages over three years is both more meaningful and more usual. For the readers benefit the graph below shows the figures for casualties in Hackney between 2001 and 2015.


All Hackney cycling casualties, from minor injur to fatalities, against year
So the numerator is correct. But, how did Dr. Aldred arrive at the denominator in the 'analysis'? This is described in the press release:
"Clearly cycling in Hackney has grown during this period, perhaps roughly doubling..."
So there we have it, the denominator in the equation is made upThe 'analysis' turns out to be a guess: 
(134 ÷ 249) ÷ (perhaps roughly doubling)
But can we do better than Dr Aldred, or at least understand the complexities? I think so.

There is no reliable cycle volume data, particularly at a London borough level. Transport for London has London wide data, but there is very great variability between boroughs and Hackney is an outlier in cycle statistics. The Department for Transport (DfT)  publish some data for Hackney, but it is not very accurate at a borough level because it is a small sample count of cycles and only on main roads.

The only reliable statistic for the increase in cycling in Hackney is the Census figures for 'Method of travel to work'. But even these figures are limited to travel to work and they are now quite dated. The figures that are available are for 2001 and 2011. 

So, below is the same calculation that Dr Aldred has done, but taking the years that have a reliable statistic for both cycling levels as well as casualties. Between 2001 and 2011 in Hackney casualties rose from 134 to 259 (93%). In the same period cycle to work Census figures rose proportionately much more, from 4940 to 17312 (250%). 
(259 ÷ 134) ÷ (17312 ÷ 4940) = 0.55
In conclusion. Over the only period for which there is a reliable and comparable statistic for growth in cycling (2001 to 2011) the casualty rate has dropped markedly. 

For the period Dr Aldred has 'analysed' there are no cycle volume figures and so Dr Aldred has guessed what the growth in cycling might be. Can such a poor analysis be regarded as good practice in either the academic or policy development milieus?

_________________________________________________________________________


Taken from the Hackney Cycling Campaign website:


IS THERE REALLY ‘SAFETY IN NUMBERS’?

JONO KENYONFEBRUARY 27

New analysis of police injury data known as Stats19 carried out for Hackney Cyclists by Dr. Rachel Aldred shows worrying trends in the borough. Hit and runs are on the increase, and are now happening at a rate of one every two days. While 11% – just over one in ten – of all injury collisions across Britain involve a hit and run vehicle, the figure’s higher in London (15%, or around one in seven) and an even higher one in five in Hackney. And while one in five sounds high enough, it’s one in four for collisions where a pedestrian or cyclist is injured.
Jono Kenyon, Co-ordinator of Hackney Cyclists, says ‘One of our three ‘asks’ for Hackney mayoral candidates was a higher priority for roads traffic policing. Hundreds of people are injured on Hackney’s roads every year while walking and cycling. Road traffic offences, from close passes to hit and runs, need to be tackled to help make our roads safer for everyone.’
Since 2005, injuries to cyclists to Hackney have increased, and although numbers have been falling in recent years, in 2015 there were almost twice as many cyclists injured in Hackney as there were in 2005 (250 vs. 134). Over the same period pedestrian injuries have been roughly stable but car and taxi occupant injuries have decreased. Dr. Aldred comments ‘Clearly cycling in Hackney has grown during this period, perhaps roughly doubling, but it’s a concern that there doesn’t seem to be much of a ‘safety in numbers’ effect for cyclists – in other words it hasn’t got much safer per trip, as cycling has gone up.’

 Join us this Wednesday 1st March to hear more about these issues and see what Hackney Cycling is proposing to ask for in terms of better protection for our communities: